Vocabulary: Thinking With Mathematical Models
| Concept | Example |
| Function: a relationship between 2
variables, say (x, y), so that, for any given value of x, a unique value of y can be calculated from an equation or read from a graph or a table. Linear Function: A relationship where the dependent variable changes at a constant rate in relationship to the change in the independent variable. The pattern of change can be recognized from a table or graph, and can be described using words or symbolic expressions. Non-Linear Function: A relationship where the dependent variable does not change at a constant rate. This non-constant rate will appear in the table, and will cause the graph to be a curve.
|
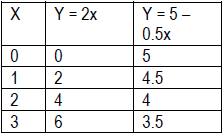
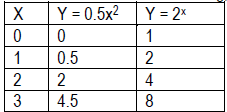
• Y = 2x and y = 5 – 0.5x are linear functions. In general y = mx + b represents a linear function. Y = 0.5x2 and y = 2x are examples of non-linear functions. • Students are familiar with the pattern of a constant rate of change in y shown below. (See Moving Straight Ahead)
• The two types of patterns shown below
|
Algebraic Expression: A combination of symbols and operations that can be evaluated if the values of the variables are given. Linear Equation: This might be an equation in 2 variables, such as y = 2x + 3, where y changes at a constant rate in relation to changes in x (see “function” above), or in one variable, such as 17 = 2x + 3 (which is just a particular case of y = 2x + 3), or 3x – 2 = 2x + 3. (See Moving Straight Ahead.) Solving Linear Equations: In the first case above, y = 2x + 3, there is an infinite number of solutions, each of which is pictured as a point on the graph of the line y = 2x + 3. In the other two cases there is just one value of x that makes the equal sign true. (See Moving Straight Ahead.) Slope: The slope of a line the ratio of vertical change to horizontal change, or (change in y) divided by (corresponding change in x). (See Moving Straight Ahead.) Y-Intercept:
The point where the graph of a |
• 2x + 3 is an algebraic expression. 3x – 2 is a different expression. Notice that we are not asked to FIND a value of x for either of the expressions. We may substitute ANY values of x into these expressions to evaluate the expression. For example, if we insert x = 1, we get 5 for the value of the first expression. • If we connect 2 expressions with an equal sign, we are asserting they are equal for some value(s) of the variable. For example, the linear equation 3x – 2 = 2x + 3 is only true for one value of x. One efficient way of solving this equation would be to do the same operations to both sides, using Properties of Equalities: 3x – 2 – 2x = 2x + 3 – 2x, or, x – 2 = 3. x – 2 + 2 = 3 + 2, or, x = 5 Or to use a graphical way of solving. (See Moving Straight Ahead)
|
| Linear Inequality: A comparison between 2
linear expressions, such as 17 > 2x + 3, or 3x – 2 < 2x + 3. This time we want to find the solutions that make the inequality sign true.
|
The rules for solving equations (see above) apply to solving inequalities, except that when we have to multiply or divide both sides of the inequality by a negative the order is reversed. For example: • 3x – 2 < 2x + 3 3x – 2 – 2x < 2x + 3 – 2x (subtracting 2x from both sides) x – 2 < 3 x – 2 + 2 < 3 + 2 (adding 2 to both sides) x < 5. This means that any value lass than 5 is a solution for the original inequality. • -3x – 5 < 4x + 2 -3x -5 -4x < 4x + 2 -4x (subtracting 4x from both sides) -7x -5 < 2 -7x – 5 + 5 < 2 + 5 (adding 5 to both sides) -7x < 7  (dividing both sides by -7) (Notice that the inequality sign reversed when both sides were divided by -7. This happens because dividing (or multiplying) by a negative changes positives to negatives and vice versa, and we know that positive integers are in the OPPOSITE order from negative integers, That is, -3 < -2, but 3 > 2.) |
| Direct variation: A relationship between 2 variables in which an increase in one variable by a particular factor creates an increase in the other variable by the same factor. A direct variation relationship, between x and y, for example, always has the form y = ax, so this is a particular case of a linear relationship. Since this can also be written as  , we can say that in a
direct , we can say that in a
directvariation relationship the ratio of the variables is always a constant.
|
• y = 0.6x shows a direct variation between x and y. As x increases, y also increases. Substituting 2 for x, we get 1.2 for y. If we double the value of x, to 4, we get double the value of y, 2.4. In every case the value of  . .
• Y = 2x + 3 would NOT be a direct |
Inverse Variation: A relationship between 2 variables in which an increase in one variable by a particular factor causes a decrease in the other variable by the same factor. An inverse variation relationship between x and y always has the format  . Since this can also be
written as . Since this can also be
written asxy = a we could say that in an inverse variation the product of the variables is always constant. The graph has a characteristic curved shape.
|
•  shows an inverse variation shows an inverse variationbetween x and y. As x increases, y decreases. When x = 0.1, y = 20. If we multiply the given x value by a factor of 4, say, then the new y-value is one fourth of what it was.  . In every case . In every casexy = 2.
|
| Mathematical Modeling: a process by which mathematical objects and operations can be used as approximations to real-life data patterns. We know that the mathematical model will not fit the real life example exactly, but there is enough of a pattern in the situation to make the model (which in this unit is a linear or non-linear function) fit reasonably well, and make predictions reasonable.
|
• Suppose we collect data about the outside temperature as a plane ascends. We would see that the temperature falls as the height increases. But we would have no way of making any accurate prediction unless we look for a pattern in the data. If we place the data in a table and look at the pattern of change, we might be able to determine if the relationship is approximately linear or not. We might also make a graph and examine the shape of the graph, to determine if the relationship is linear, or if the pattern fits some other relationship we recognize. |


 .
.
