

Collecting and Fitting Quadratic Data
Goals:
1. Describe graphically, algebraically, and verbally
real-world phenomena as functions;
identify the independent and dependent variables. (3.01)
2. Graph relations and functions and find the zeros of the functions. (3.03)
3. Use quadratic equations and inequalities to solve problems. Solve by graphing
and
using the quadratic formula. (3.05)
4. Find and interpret the maximum and minimum values and the intercepts of a
quadratic function. (3.06)
5. Write and interpret an equation of a curve (linear, exponential, quadratic)
which
models a set of data. (4.01)
6. Find the equation of the curve of best fit (linear, exponential, quadratic)
for a set of
data. Interpret the coefficients, and based in the context of the data. Check
the
equation for goodness-of-fit and use the equation for predictions. (4.02)
Students will use the Calculator-Based Laboratory and
their calculators to collect data.
There will be attention to the role of the physics of a free-falling object.
Materials and equipment needed by students:
If students collect their own data:
1. CBL, motion detector, and cable for each group
2. Several objects to consider for free-fall—one that shows normal free-fall (we
will use
a small weighted object) and another that shows the impact of drag (we will use
a
baseball hat).
3. Calculator with Balldrop program
4. Paper and pencil
5. Copy of student handout
If students use data collected by teacher:
1. Calculator
2. Paper and pencil
3. Copy of student handout
4. One CBL and motion detector for the teacher, and cable for each group.
Activity One: What is a CBL and motion detector and
what will it do?
Explain the CBL and motion detector with the calculator by using the Hiker
program.
Make sure students know the units that are being used in the data. Have some
object that
is moved within the range of motion detector and have students see the graph
that is
produced (by having the CBL connected to the overhead projector. Keep in mind
that the
motion detector will not collect data accurately if the object is less than
approximately 2
feet from the detector.
Activity Two: Drop a weighted object to create a
quadratic.
1. Set up the motion detector on the floor. Stand with the object about 5
feet above the
motion detector. Run the program Balldrop. Data is taken for about 0.4 seconds
with
observations recorded every 0.02 seconds. Look at the resulting scatter plot.
Find where
the list of data is recorded.
2. Using the Select( option from the List Ops menu, select
the data that clearly shows the
freefall of the weighted object and store it in L3,L4. Look at the new scatter
plot in (L3,
L4).
3. Move the data so that the maximum point is located with
an x − value of 0. This can
be done by L3=L3-L3(1). If students are not collecting the data themselves, the
teacher
will adjust the data so that time values (L3) are rounded to the nearest
hundredth and the
height values (L4) are rounded to the nearest hundredth. This rounding affects
the data
little, but aids in students being able to input data into their calculators.
4. The data should look clearly quadratic. Find the
quadratic function that best fits this
data.
5. Look at the residuals for this function by calculating
L4-Y1(L3) in a list. Plot these
values against L3.
6. Look at the resulting quadratic function and identify
the coefficients and identify what
each measures. The coefficient of x2 shows
 ,
where g is the force due to gravity (32
,
where g is the force due to gravity (32
ft/sec2). The coefficient of x is the initial velocity. The constant term is
the initial
position.
7. Using the graph and/or the quadratic formula, determine
when the weighted object
will hit ground.
An example follows:

The coefficient of the quadratic term of the function is –13.5. It is near
–16ft/sec2 ,
which is the value of
 ,
where g = 32m/ sec2 .
,
where g = 32m/ sec2 .
The coefficient of the linear term is the initial velocity
of the falling hat. It should be
nearly 0.
The constant term should be the height of the hat at time
0 or the initial height. In this
case the height is about 4.5 feet.
The zero of this function occurs at (0, 0.523) which means that the weighted
object will
hit ground at approximately 0.523 seconds. Note that the window must be expanded
to
find this zero.
Activity Three: Drop the hat, another quadratic.
1. Again using the Balldrop program we will measure the height of the hat over
time.
We should see similar behavior to that of the weighted object, but there will be
differences since the hat has drag if it is dropped to “catch” the air.
2. Again, using Select( look at the data that appears related to the hat
dropping. Also,
adjust data for easy input by students if they are not collecting the data for
themselves.
Move the data so that the maximum point occurs at time 0.
3. Fit the data with a quadratic function and determine the meanings of the coefficients.
4. Determine when the hat will hit ground.
An example follows:


Notice that the coefficient of the quadratic term of the function has changed
from the
previous example. It should be near –16ft/sec2 , but is decreased because the
pull of
gravity is diminished because of the shape of the hat.
The coefficient of the linear term is the initial velocity of the falling hat.
It should be
nearly 0.
The constant term should be the height of the hat at time 0 or the initial
height. In this
case the height is about 3.9 feet.
The hat hits ground at approximately time 0.547 seconds. This can be found using
the
zero option from the CALC menu. This can also be answered using the quadratic
formula. Notice that would produce two answers, one is not relevant to this
problem.
Follow Up Activity
This repeats the problem from the lesson on Football and Braking Distance.
Please refer
to that lesson for the answers to this follow up activity.
Student Handout
Collecting and Fitting Quadratic Data
Algebra 2
In this lesson we will use the Calculator-Based Laboratory (CBL), the
calculator, and
the motion detector to take data of falling objects. These data should fit the
equation form
where a = −32 ft / sec2 as the force due to gravity,
 is the initial
velocity, and
is the initial
velocity, and
 is
is
the initial height of the object. The first time-value should be 0.
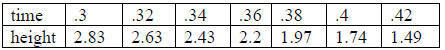
1. A standard falling object:
| time | |||||||||
| height |
| time | |||||||||
| height |
(Complete table if data cannot be transferred into the calculator)
a. Find the function that best fits this data.
b. Determine the goodness of fit of this function. Justify your answer.
c. Describe the meaning of the coefficients in this function as related to the
activity used in collecting the data.
d. Find the zero of this function. What is the meaning of the zero in this activity?
2. A falling object with drag:
| time | |||||||||
| height |
| time | |||||||||
| height |
(Complete table if data cannot be transferred into the calculator)
a. Find the function that best fits this data.
b. Determine the goodness of fit of this function. Justify your answer.
c. Describe the meaning of the coefficients in this function as related to the
activity used in collecting the data.
d. Find the zero of this function. What is the meaning of the zero in this activity?
Follow Up Problem
Collecting and Fitting Quadratic Data
Algebra 2
Revisit a data set that we have considered in the past.
A student standing on the top of the bleachers throws a football across the
field.
The data that follows gives the height of the ball in feet versus the seconds
since
the ball was thrown.

This data comes from page 110 of Contemporary Precalculus through Applications,
by Barrett et al.,
Everyday Learning Corporation, copyright 2000.
a) Show a scatter plot of the data. What is the independent variable, and what
is
the dependent variable?
b) What prediction equation (mathematical model) describes this data? (Use
quadratic regression from the calculator.)
c) Find the residuals for this regression curve. Is there a pattern?
d) Explain the meaning of the constants in this equation.
e) When will the ball hit the ground?